The htop utility is a robust and highly adaptable command-line application designed for real-time visualization and management of system resources and active processes. As an enhanced replacement for the classic top command, htop significantly improves usability with its intuitive, colorful, and fully interactive interface. It provides seamless vertical and horizontal scrolling through process lists, supports mouse input for ease of navigation, and allows users to personalize the layout to suit their monitoring needs.
What truly sets htop apart is its clear, color-coded representation of system metrics — including CPU, RAM, and swap usage — enabling users to instantly grasp performance trends and detect bottlenecks. This makes it an indispensable tool not just for developers and system administrators, but for any Linux power user aiming to maintain system efficiency.
With htop, monitoring and managing processes becomes effortless: users can identify high-resource tasks, track CPU and memory usage in real time, and even terminate or reprioritize processes directly within the interface. Thanks to features like responsive keyboard navigation, advanced filtering, and customizable display fields, htop transforms system monitoring into a streamlined and user-centric experience — all from the comfort of the terminal.
What You’ll Learn
Spend less than 5 minutes reading this article, in which we will walk you through why you should use it, how to install it, how to start it up, how to use it, and how to delete it if needed. Let's go!
Why I need to choose htop instead of top?
In contrast to the conventional top command, htop offers enhanced capabilities that allow users to:
- Effortlessly browse the list of active processes using the arrow keys, ensuring fast and intuitive navigation within the terminal interface;
- Instantly kill frozen or unwanted processes right from the dashboard — no need to enter separate commands or switch tools;
- Keep an eye on system performance with real-time visual feedback on CPU activity, memory consumption, and swap usage;
- Organize and prioritize process data by sorting it based on criteria like processor load, memory usage, or owning user, making system diagnostics faster and more effective;
- Tailor the interface to your workflow by selecting which columns and data points are shown, so you only see the metrics that matter to you.
Step 1: Update the Package List
Before installation, it's recommended to update the list of available packages:
sudo apt updateStep 2: Install htop
Now install htop using the standard APT package manager:
sudo apt install htopDebian will download and install all necessary dependencies. After the installation finishes, the tool becomes immediately available for use.
Step 3: Launch htop
To start the utility, run:
htop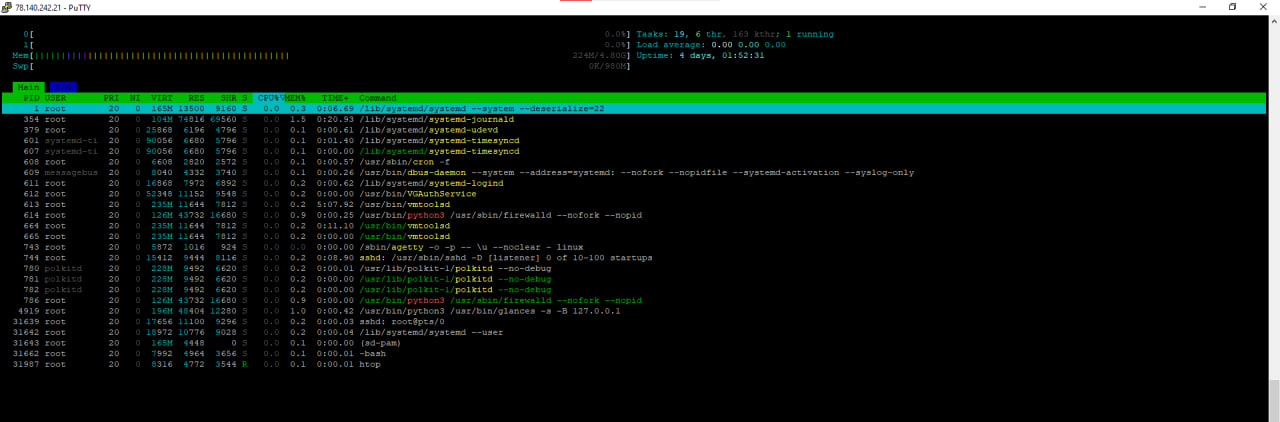
Once started, htop presents a dynamic, visually engaging, and easy-to-navigate interface that immediately gives users insight into system activity. You’ll be able to monitor real-time CPU usage, observe how much RAM is currently in use versus what’s available, review a comprehensive list of active processes along with their priority levels, and check how long the system has been running, along with other vital performance data:
- The current CPU load;
- The amount of used and free memory;
- A list of running processes and their priorities;
- System uptime and other relevant system information.
Sample htop Window:
 PID USER PRI NI VIRT RES SHR S CPU% MEM% TIME+ Command

1234 root 20 0 100M 10M 5M S 5.0 0.5 0:00.50 nginx
Additional Commands and Options
- F2 — Setup
- F3 — Search
- F6 — Sort
- F9 — Kill process
- F10 — Quit
What's in the End?
htop is a valuable and versatile tool that belongs in the arsenal of every system administrator, infrastructure specialist, and experienced Linux user. It stands out from conventional monitoring utilities by providing a dynamic, real-time interface for observing system performance. With htop, you can instantly pinpoint overloaded resources, monitor active processes, and take direct action — all from within an intuitive, keyboard-driven environment. Its flexible layout and configurable views make it easy to sort processes by various parameters, monitor CPU and memory usage at a glance, and manage tasks without relying on complex command-line syntax. Whether you're managing production servers, diagnosing system slowdowns, or fine-tuning resource allocation, htop simplifies the process and gives you clear, actionable insights into the system’s health.
To remove it, if needed, use this:
sudo apt remove htopServerspace Knowledge Base
The Serverspace Knowledge Base is a comprehensive and meticulously organized collection of resources designed to help users unlock the full potential of their cloud infrastructure. It offers clear, step-by-step instructions and detailed tutorials spanning a wide array of topics such as server deployment, system administration, network setup, security improvements, and performance optimization strategies.
This repository is continuously updated to keep pace with the latest technological advancements, software updates, and industry standards, guaranteeing that users have access to the most current and reliable information available.
Whether you are a beginner configuring your first virtual server or a seasoned IT expert overseeing complex cloud environments, the Knowledge Base provides valuable insights and practical solutions tailored to your needs. It includes troubleshooting guides, frequently asked questions, and expert tips designed to quickly address common challenges, minimize downtime, and enhance operational efficiency. By centralizing this extensive knowledge, the Serverspace Knowledge Base empowers users to confidently manage their cloud resources independently and effectively.
Within the Serverspace Knowledge Base, you’ll find a rich selection of materials focused on Debian as well as practical tutorials for optimizing various Linux distributions. From initial installation and configuration to advanced diagnostics and system tuning, the content caters to a broad skill range. Additionally, the guides offer best practices for securing your systems and maximizing resource utilization to maintain stable and high-performing environments. Regularly refreshed with new insights and updates, the Knowledge Base ensures you stay informed about emerging trends, security patches, and innovative tools to keep your infrastructure secure and efficient.


