When working with many different devices in an infrastructure, it is necessary to ensure their correct and secure functioning. One source of potential threats is network traffic, both external and internal. Without proper systems in place to analyse and monitor it, many attacks or system problems can go unnoticed or cause significant damage when working!
In this article, we will look at how to collect and more effectively analyse network traffic on a machine using the tcpdump + wireshark toolkit on Linux and Windows.
How is traffic sniffing done?
To sniff or intercept network connections on a device, tcpdump uses the sniffing technique. In which, the pcap library accesses the network adapter driver to gather information about the connections. After all, it is in the buffer used by the driver that the original and unchanged network packets are found!
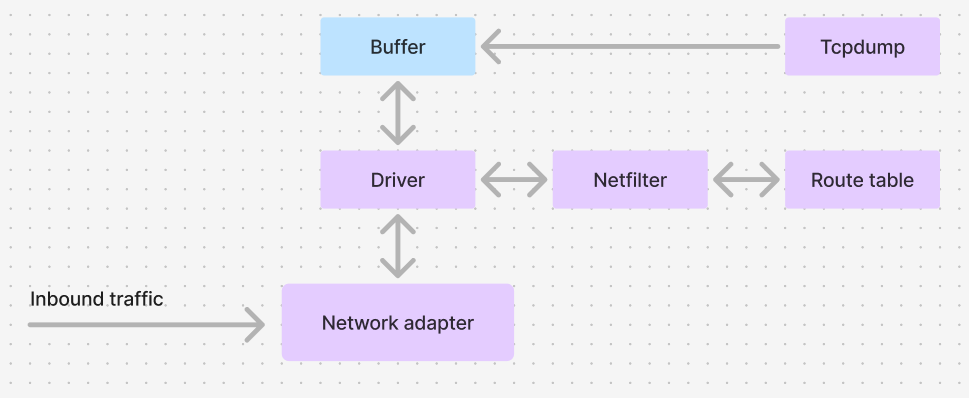
And Wireshark in this connection can additionally analyse them and provide analytics for each of them, as well as provide a convenient panel for searching and filtering the necessary connections!
Collecting and analysing network traffic
Let's determine the layout of our infrastructure and the machines from which we will intercept connections:
- For networks where we need to collect from servers we will use tcpdump, it will generate a pcap file and send it to the working machine where Wireshark is installed for analytics;
- If we collect traffic from a user's work machine, we can immediately perform analytics on it using only Wireshark.
We will need only the standard set of distribution packages and additionally installed tcpdump, Wireshark.
In most cases it is already there, however, you can install it with the Linux command for deb-like systems:
apt update && apt install tcpdump wireshark -y For rpm-like solutions, the command will look like this:
dnf install tcpdump wireshark -y Let's look at the main features and examples of using tcpdump: filters, options and modes of operation. Let's define a pool of interfaces:
ip a 
In order to intercept traffic from a specific interface, let's specify the -i option:
sudo tcpdump -i enp0s5 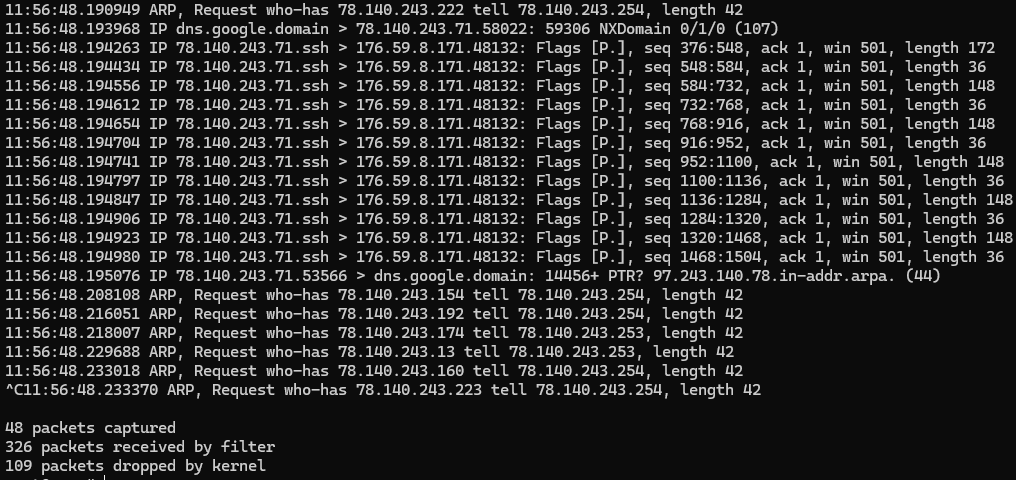
There is a lot of traffic and the output on the screen will be just as voluminous, so it is almost impossible to analyse almost anything in this view. Let's specify with the -w option the file to which we will record, as well as filters to search for a specific connection:
- port - Filtering by port (for example, port 80);
- host - Filtering by IP address or host name (for example, host 192.168.1.1);
- src - Filtering by source address (e.g., src 192.168.1.1);
- dst - Filtering by destination address (e.g., dst 192.168.1.2);
- tcp - TCP packet filtering;
- udp - Packet filtering by UDP protocol;
- icmp - ICMP packet filtering.
All these filters must be linked by the operators:
- AND;
- OR;
- NOT.
For example, I am interested in my SSH connection, hence the command will look like this:
tcpdump -i enp0s5 host tcp port 22 
Instead of a thousand packets, there are already a few! But sometimes we need all the traffic to analyse the picture, so we record it from all interfaces with the command with the option -i any, where any is a pseudo-interface that listens to traffic from all sources. To view the recorded traffic on the same machine we open the command:
tcpdump -r /path-to-file
We can then open it via WireShark by passing the file to the primary device:
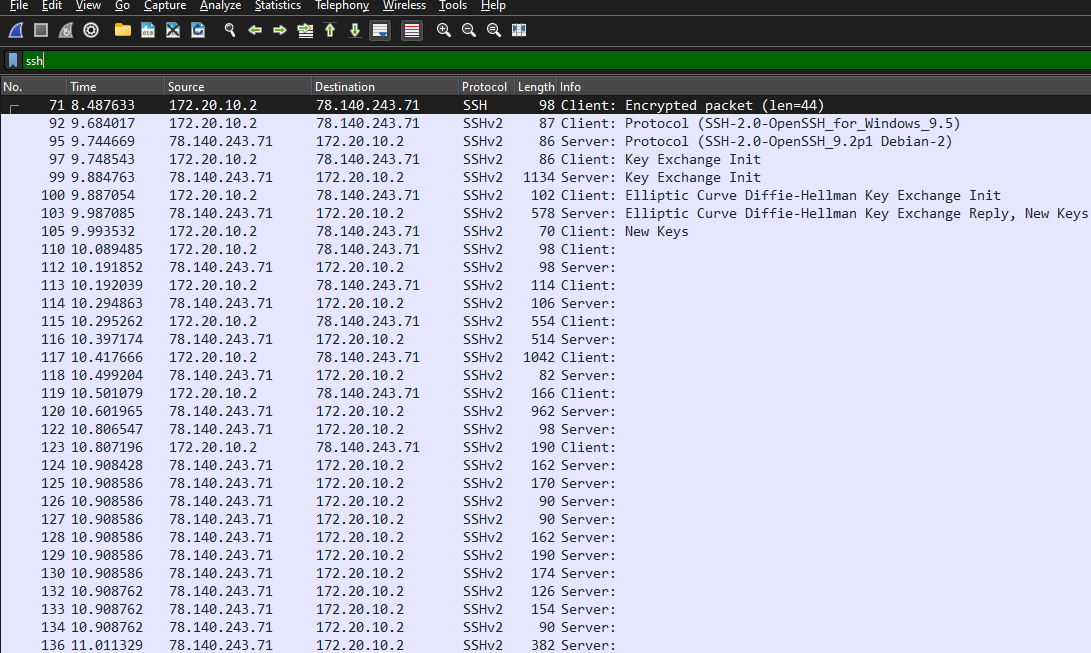
The filters on Wireshark have the same filtering logic where we specify:
((!(ip.addr == 46.191.184.42)) && !(ip.addr == 172.23.0.2)) && !(ip.addr == 172.23.0.3)It is important that each of the expressions be in separate brackets! To view the payload in Wireshark software, select the desired packet, and for tcpdump, add the -A option when reading it:
tcpdump -A -r /path-to-file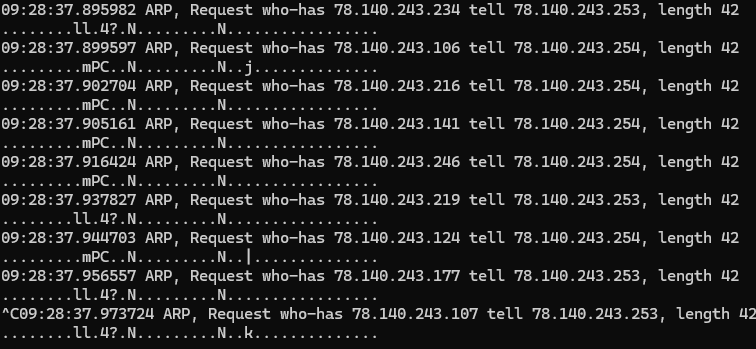
In a similar way, you can check for connectivity to different devices and the information they are transmitting. Intruders often modify packets or protocol algorithms, this formulations allows you to identify this immediately! In that article, we learned how to utilize packet analyzer or network packet capture tools!
As a result of executing these commands you should get a list of parameters of the requested objects. If you don't have sufficient resources than you can perform actions on powerful cloud servers. Serverspace provides isolated VPS / VDS servers for common and virtualize usage.
Conclusion
Using tcpdump and Wireshark together provides a powerful toolkit for capturing, analysing, and monitoring network traffic. Tcpdump is ideal for server-side packet collection, creating pcap files, while Wireshark offers advanced filtering, visualization, and payload inspection on workstations. By applying filters, recording traffic, and reviewing captured data, you can quickly identify anomalies, troubleshoot network issues, and enhance security. Mastering these tools is essential for network administrators, security professionals, and anyone responsible for maintaining reliable infrastructure.
FAQ
- Q1: What is the difference between tcpdump and Wireshark?
A: Tcpdump is a command-line tool for capturing network packets, suitable for servers and scripting. Wireshark is a graphical tool for analysing packet captures with advanced filtering and visualization capabilities. - Q2: How do I capture traffic from a specific network interface?
A: Use the -i option with tcpdump, for example:sudo tcpdump -i enp0s5For all interfaces, use -i any.
- Q3: How can I filter traffic by port, host, or protocol?
A: Tcpdump supports filters such as:
port 80 - filter by port
host 192.168.1.1 - filter by host
tcp, udp, icmp - filter by protocol
Combine them with AND, OR, NOT. - Q4: Can I analyse tcpdump captures in Wireshark?
A: Yes. Save tcpdump output to a .pcap file using -w and open it in Wireshark for detailed analysis and visual filtering. - Q5: How do I view packet payloads in tcpdump?
A: Use the -A option when reading a capture file:tcpdump -A -r /path-to-file - Q6: Are there best practices for secure packet capture?
A: Yes. Limit access to capture files, avoid exposing sensitive data, and use isolated environments or cloud servers for heavy traffic analysis to prevent affecting host performance.


